
拥有超能力的电子表格 ✨!

小图表?
用于 Flutter 应用上快速数据可视化的 Sparkline 图表
安装
flutter pub add tiny_charts
用法
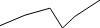
折线图
从偏移量
void build(BuildContext context) {
  return TinyLineChart(
    width: 100,
    height: 28,
    dataPoints: const [
      Offset(0, 2),
      Offset(1, 11),
      Offset(2, 17),
      Offset(2.5, 0),
      Offset(3, 10),
      Offset(4, 24),
    ],
  );
}
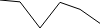
从向量
使用 vector_math 的 Vector2 类。
import 'package:vector_math/vector_math.dart';

void build(BuildContext context) {
  return TinyLineChart.fromDataVectors(
    width: 100,
    height: 28,
    dataPoints: [
      Vector2(0, 14),
      Vector2(1, 13.2),
      Vector2(2, 2),
      Vector2(3, 13),
      Vector2(4, 10),
      Vector2(5, 4),
    ],
  );
}
带有选项
传递自定义选项

void build(BuildContext context) {
  return TinyLineChart(
    width: 100,
    height: 28,
    dataPoints: const [
      Offset(0, 2),
      Offset(1, 11),
      Offset(2, 17),
      Offset(2.5, 0),
      Offset(3, 10),
      Offset(4, 24),
    ],
    options: const TinyLineChartOptions(
      color: Color(0xFFC93B8C),
      lineWidth: 3,
      yMinLimit: -2,
      yMaxLimit: 27,
    ),
  );
}
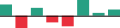
条形图
单个

void build(BuildContext context) {
  return TinyBarChart.single(
    value: 68.12,
    max: 100,
    color: const Color(0xFF236536),
    width: 120,
    height: 28,
  );
}
堆叠

void build(BuildContext context) {
  return TinyBarChart.stacked(
    data: const <double>[24, 12, 4],
    width: 120,
    height: 28,
  );
}
从数据向量

void build(BuildContext context) {
  return TinyBarChart.stackedFromDataVectors(
    dataPoints: <Vector2>[
      Vector2(1, 20),
      Vector2(2, 12),
      Vector2(0, 12),
      Vector2(4, 24),
    ],
  );
}
带有选项

void build(BuildContext context) {
  return TinyBarChart.stacked(
    data: const <double>[24, 12, 4],
    options: const TinyBarChartOptions(
      colors: [
        Color(0xFFFF0000),
        Color(0xBEEE0260),
        Color(0x97FF74AD),
      ],
    ),
    width: 120,
    height: 28,
  );
}
柱状图?
从值

void build(BuildContext context) {
  return TinyColumnChart(
    data: const [20, 22, 14, 12, 19, 28, 1, 11],
    width: 120,
    height: 28,
  );
}
从向量

void build(BuildContext context) {
  return TinyColumnChart.fromDataVectors(
    dataPoints: [
      Vector2(0, 18),
      Vector2(6, 22),
      Vector2(2, 12),
      Vector2(3, 14),
      Vector2(5, 34),
      Vector2(4, 5),
      Vector2(1, 24),
    ],
    width: 120,
    height: 28,
  );
}
带有负值

void build(BuildContext context) {
  return TinyColumnChart(
    data: const [20, -22, 14, -12, -19, 28, 1, 11],
    width: 120,
    height: 28,
  );
}
带有选项
- 带有轴
void build(BuildContext context) {
  return TinyColumnChart(
    data: const [20, -22, 14, -12, -19, 28, 5, 11],
    width: 120,
    height: 28,
    options: const TinyColumnChartOptions(
      positiveColor: Color(0xFF27A083),
      negativeColor: Color(0xFFE92F3C),
      showAxis: true,
    ),
  );
}
- 自定义颜色

void build(BuildContext context) {
  return TinyColumnChart(
    data: const [18, 22, 28, -12, 32, 12, 9, 14, -34, -25, 24],
    width: 120,
    height: 28,
    options: const TinyColumnChartOptions(
      positiveColor: Color(0xFF0023C6),
      negativeColor: Color(0xFFBA2500),
      showAxis: true,
      axisColor: Color(0xFF00FF00),
      lowestColor: Color(0xFFFF4A1A),
      highestColor: Color(0xFF3083FF),
      firstColor: Color(0xFFFFE500),
      lastColor: Color(0xFF8000FF),
    ),
  );
}


